Para ejecutar un script de powercli mediante el programador de tareas, es necesario prepararlo para poder ser invocado desde powershell.
El script debe comenzar invocando el snapin de vmware:
add-pssnapin VMware.VimAutomation.Core
Antes de pasar a una tarea programada, recomendamos probar el script invocandolo a través de powershell:
powershell.exe c:\myscript.ps1
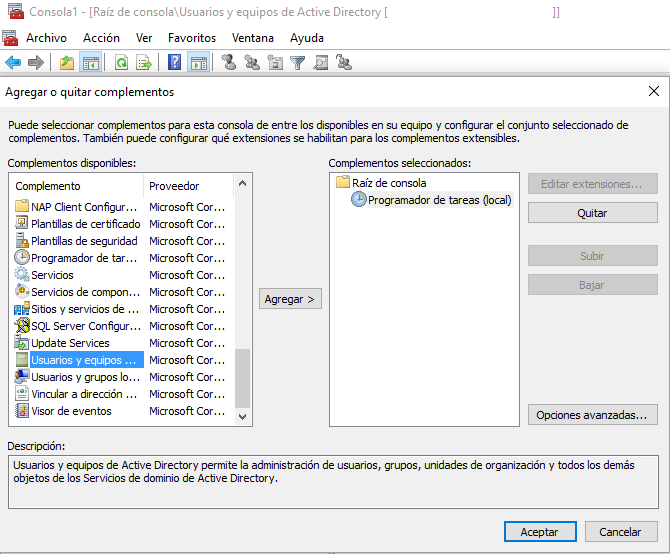
Tarea programada en windows
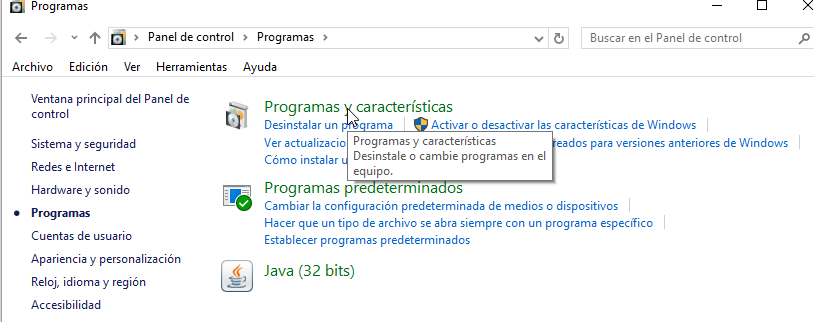
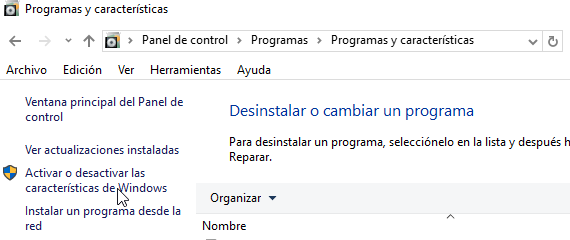
Herramientas administrativas > Programador de tareas
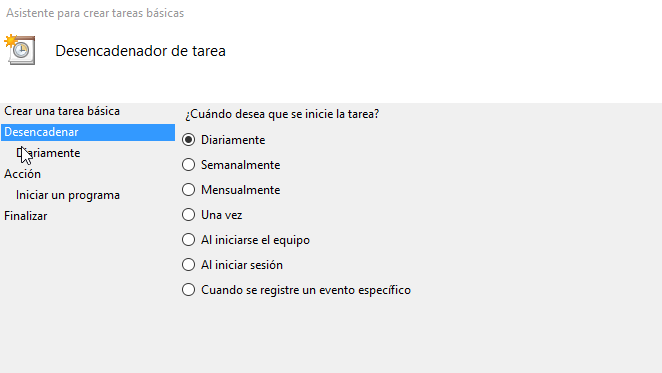
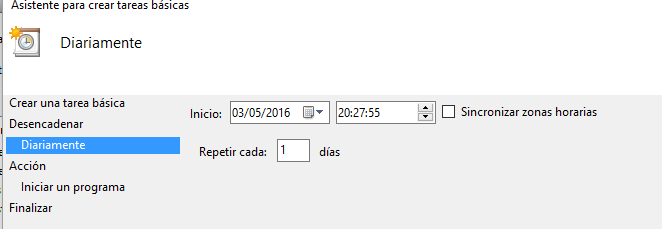
Tarea básica: Hora y fecha de comienzo.
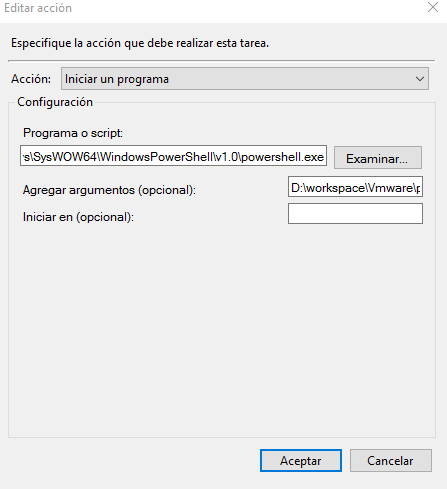
Acción: Iniciar un programa
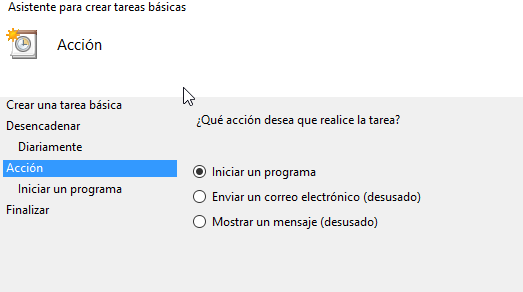 Poner ruta de powershell y del script de powercli completa:
C:\Windows\SysWOW64\WindowsPowerShell\v1.0\powershell.exe